

A new open-access food composition dashboard from the European Food Safety Authority (EFSA) gives consumers, researchers and advocates a more transparent way to examine the nutritional make-up of foods. For seafood consumers, it is especially useful because it shows how nutrient data can be organised, compared and verified across a very large set of foods, including branded products, recipes, fortified foods and supplements.
For the Seafood Consumers Association, the most important lesson is simple: good seafood information depends on good data. When nutrient data are harmonised and clearly referenced, it becomes much easier to compare products, test claims and identify where nutrition labels may be incomplete, inconsistent or misleading.
What EFSA has released
EFSA’s new dashboard brings together harmonised food composition data for about 28,000 foods from across Europe. It includes nutrient values, quality scores, food classifications, methodologies and references in one place.
That matters because food composition data are not just technical records for scientists. They shape the evidence behind dietary guidance, food policy, nutrition research and consumer claims. For seafood, they can help answer practical questions such as whether a product is a good source of protein, omega-3 fats, iodine or other key nutrients, and whether processing or added ingredients have changed the product’s nutritional profile.
Why seafood consumers should care
Seafood is often promoted as a nutritious choice, but not all seafood products are equal. Fresh fish, frozen fillets, smoked seafood, breaded products, ready meals and tinned products can differ significantly in sodium, fat, protein and micronutrients.
The EFSA dashboard is useful because it encourages consumers to look beyond marketing claims and focus on the actual composition data. That is especially important for seafood products with added salt, sauces, coatings or fortification, where the final product may look like seafood but behave very differently nutritionally.
For consumers, the most important data points are:
- Protein content.
- Omega-3 fatty acids, where available.
- Sodium.
- Saturated fat.
- Energy content.
- Key minerals and vitamins, especially iodine, selenium, vitamin D and vitamin B12.
- Whether the product is raw, cooked, processed, fortified or part of a composite meal.
Australia and the EU: key differences
Australia already has its own food composition resource through the Australian Food Composition Database, which serves as the main local reference for nutrient values in foods. EFSA’s dashboard is different in scale and presentation, with a strong emphasis on harmonisation across European countries and on linking data to food classification systems and supporting metadata.
The main differences for consumers and advocates are:
- Scope and integration. The EFSA resource brings together a very large, harmonised European dataset, while Australia’s database is more nationally focused.
- Metadata depth. EFSA places stronger emphasis on quality scores, methodology and reference tracing.
- Classification system. EFSA uses FoodEx2, which helps standardise foods across countries and studies.
- Use case. Australia’s database is highly relevant for local food labelling, dietary analysis and research; EFSA’s system is especially useful as an international benchmark and model for transparency.
For seafood advocacy, the comparison is valuable. Australia can learn from the EU approach to data standardisation, while still relying on local food composition data for domestic policy, labelling and consumer guidance.
What matters most in seafood data
For seafood consumers, the most valuable information is not the largest dataset, but the most decision-relevant data. The following should be the priority:
1. Nutrient values per 100g and per serving.
2. Product form and processing method.
3. Added ingredients, especially salt, sugars, oils and coatings.
4. Country or system used for the nutrient data.
5. Date and source of the composition record.
6. Quality or confidence indicators where available.
7. Food classification that distinguishes whole seafood from mixed products.
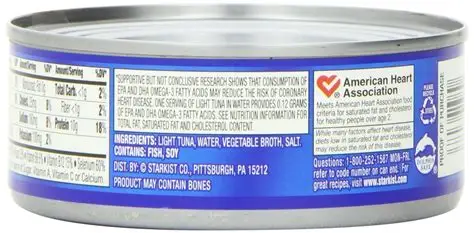
This is where many consumer claims become clearer. A fish fillet and a crumbed fish portion may both be called “fish,” but they are nutritionally very different products. The same applies to plain tuna versus flavoured tuna or tinned tuna in brine versus oil.
What SCA can say to consumers
SCA can frame this development as a call for more honest seafood information. Consumers deserve to know not just what species they are buying, but what the product actually contains after processing, packaging and formulation.
A strong consumer message would be:
- Choose seafood using nutrient data, not just species reputation.
- Check whether the product is whole, processed or mixed.
- Compare sodium, fat and protein across similar products.
- Look for clear references and transparent composition sources.
- Treat branded seafood products as formulations, not assumptions.
This approach supports better purchasing decisions and also strengthens advocacy for clearer labelling and better public access to reliable food data.
Why this matters for policy
The EFSA dashboard shows the value of open, harmonised and well-documented food composition data. For Australia, that raises an important policy question: how can we make nutrient data more accessible, more standardised and more useful for consumers?
For seafood policy, the answer is not just better nutrition databases. It is also better alignment between composition data, labelling rules, traceability systems and consumer protection. That is where seafood consumers gain the most: when data, regulation and claims all point to the same reality.
References available.
Comments
No comments yet.